
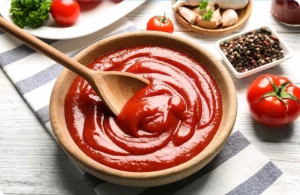
This is a professional overview of the color metrics used in tomato concentrates and sauces. Color is a critical factor determining the product’s quality, freshness, and visual appeal.
The color metrics L and a/b are measured using standardized color spaces, typically the Hunter Lab or CIE Lab systems.
1. Definition and Significance of the Metrics
| Metric | Name | Significance | Measurement Goal |
| L | Lightness | Represents the product’s brightness level. Scale ranges from 0 (pure black) to 100 (pure white). | Measures color depth. A lower L value means a deeper tomato color. |
| A/B | Redness Ratio | The ratio of the a value (red-green axis) to the b value (yellow-blue axis). This is the single most important color metric for tomato quality. | Measures color purity. A higher A/B value means the product is redder, with less of a yellow or brownish cast. |
2. Main Factors Influencing Color Metrics
The color of tomato products is primarily influenced by the following factors:
| Influencing Factor | Impact on L Value | Impact on A/B Value |
| Lycopene Content | L value decreases (deeper color) | A/B value increases (redder color) |
| Maturity | More mature, L value is lower | More mature, A/B value is higher |
| Variety | Different varieties have different natural pigment contents | Different varieties have different natural pigment contents |
| Processing and Heating | Overheating or oxidation can cause the L value to increase (lighter color) and the $\text{A/B}$ value to decrease (more yellow/brown), indicating quality degradation. |
3. Typical Ranges for Color Metrics
Standard ranges vary by product and concentration, but there are general quality tendencies:
| Metric | Range for High-Quality Tomato Paste | Significance |
| L | Approximately 20.0 to 24.0 | L value should not be too high. Too high (e.g., >26.0) may indicate the color is too light or unnecessary fillers were added. |
| A/B | Excellent quality often requires 2.10 or higher. | The A/B value must be as high as possible. Below 2.00 may indicate overheating, stale raw materials, or insufficient maturity. |
4. Primary Role and Customer Selection
Color metrics directly relate to the product’s visual appeal, raw material quality, and processing control:
| Area of Impact | Role in Customer Selection | How to Make a Selection |
| Visual Appeal | Color is the consumer’s first impression. Pure, vibrant color increases purchase intent. | Choose products with a high A/B value to ensure a uniform, rich red color. |
| Raw Material Quality | A/B is an indirect measure of raw tomato maturity, freshness, and Lycopene content. | Raw materials with a high A/Bvalue (e.g., >2.15) typically suggest better nutritional quality and a richer natural flavor. |
| Processing Control | Color reflects whether the product was scorched or oxidized during the heating process. | Both L and A/B values must be stable. Excessive batch-to-batch variation indicates instability in the factory’s heating and storage processes. |
Judging Product Quality:
- Good Product: High and stable A/B value, with an L value that is medium-to-low (deep, but not overly dark color).
- Poor Product: Low A/B value (yellowish/brownish), and a high L value (color is too light).
If you choose my company ,i can sure that the A/B and L are stable and a/b above 2.1
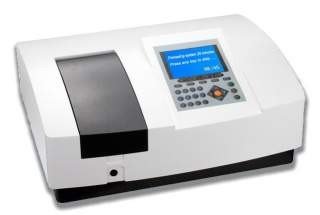
5. Color Metric Measurement Method
Color measurement typically uses a Colorimeter or Spectrophotometer. These devices are specifically designed to quantify the color perception of the human eye:
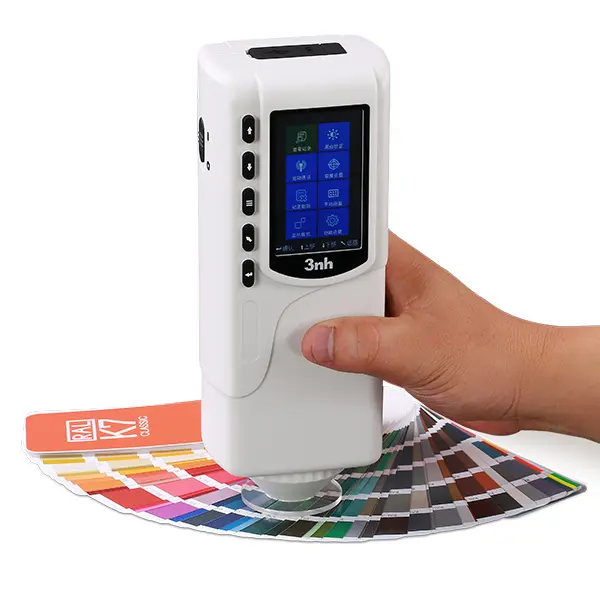
- Sample Preparation: Place the tomato paste or concentrate sample into a standard viewing dish or cuvette.
- Calibration: Calibrate the instrument using a standard white and black tile.
- Measurement: Place the sample under the measuring aperture. The instrument projects light onto the sample.
- Calculation: The sensor receives the reflected light and automatically calculates theL, a (red/green), and b (yellow/blue) values based on the CIE Lab color space algorithm.
- Deriving A/B: Finally, the a value is divided by the b value to get the crucial A/B ratio.
As a client, you should always request the supplier to provide the latest A/B ratio report as one of the standards for quality acceptance.
